Gas and electricity monitoring app
Building a Rails and AngularJS web application that charts gas and electricity smart meter readings for an employment agency: approach, process and screenshots.
Overview
A freelance project: I took a few days off from my regular work to build an application for an employment agency located in Holland.
The client organizes work for people in the agricultural sector and provides accommodation for its employees during their employment. The client wanted to monitor gas and electricity consumption in those places.
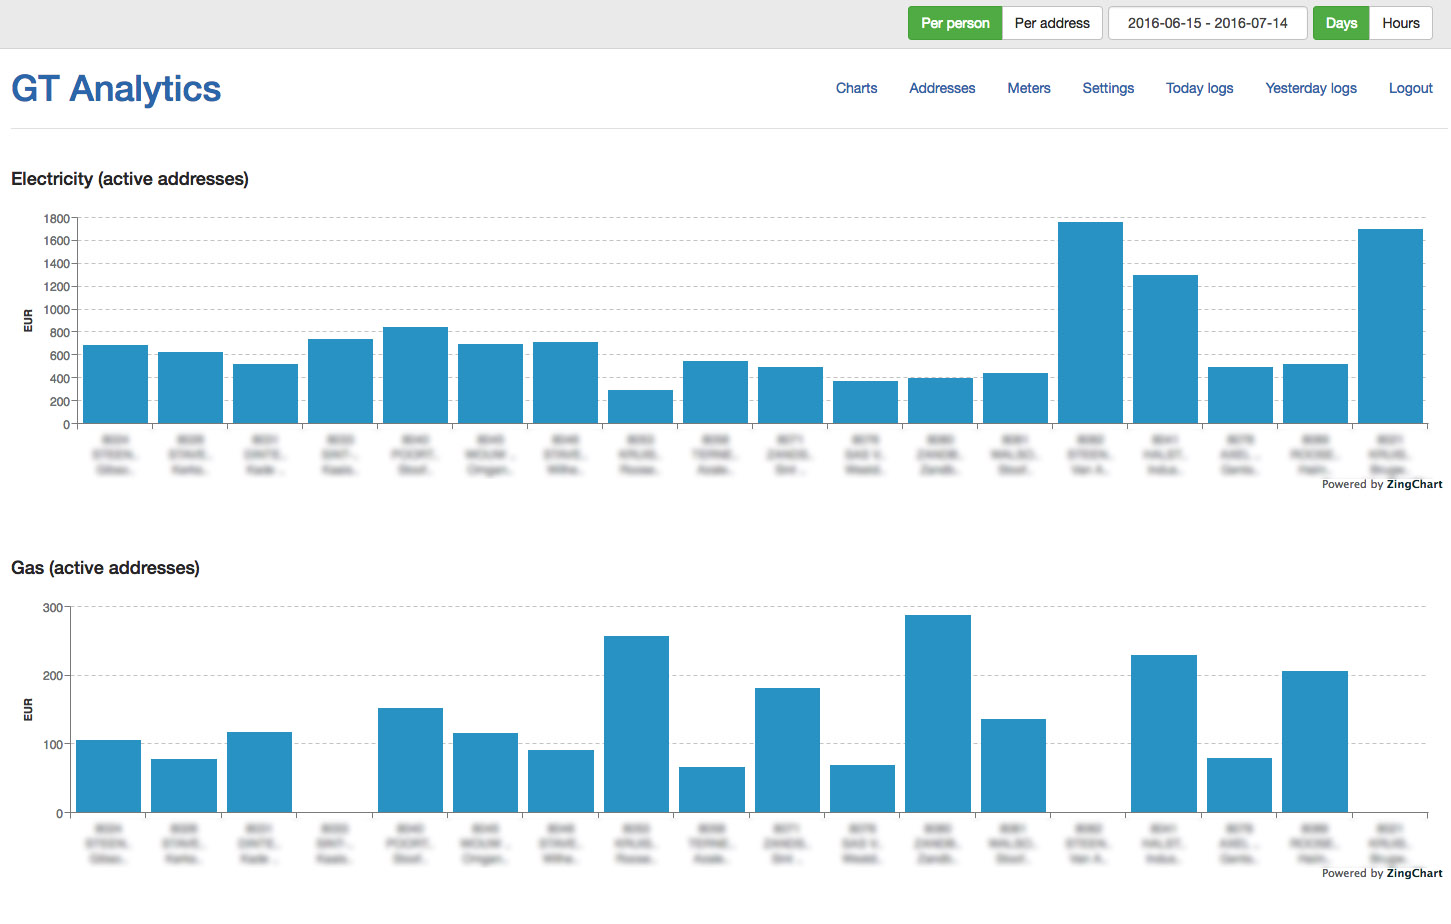
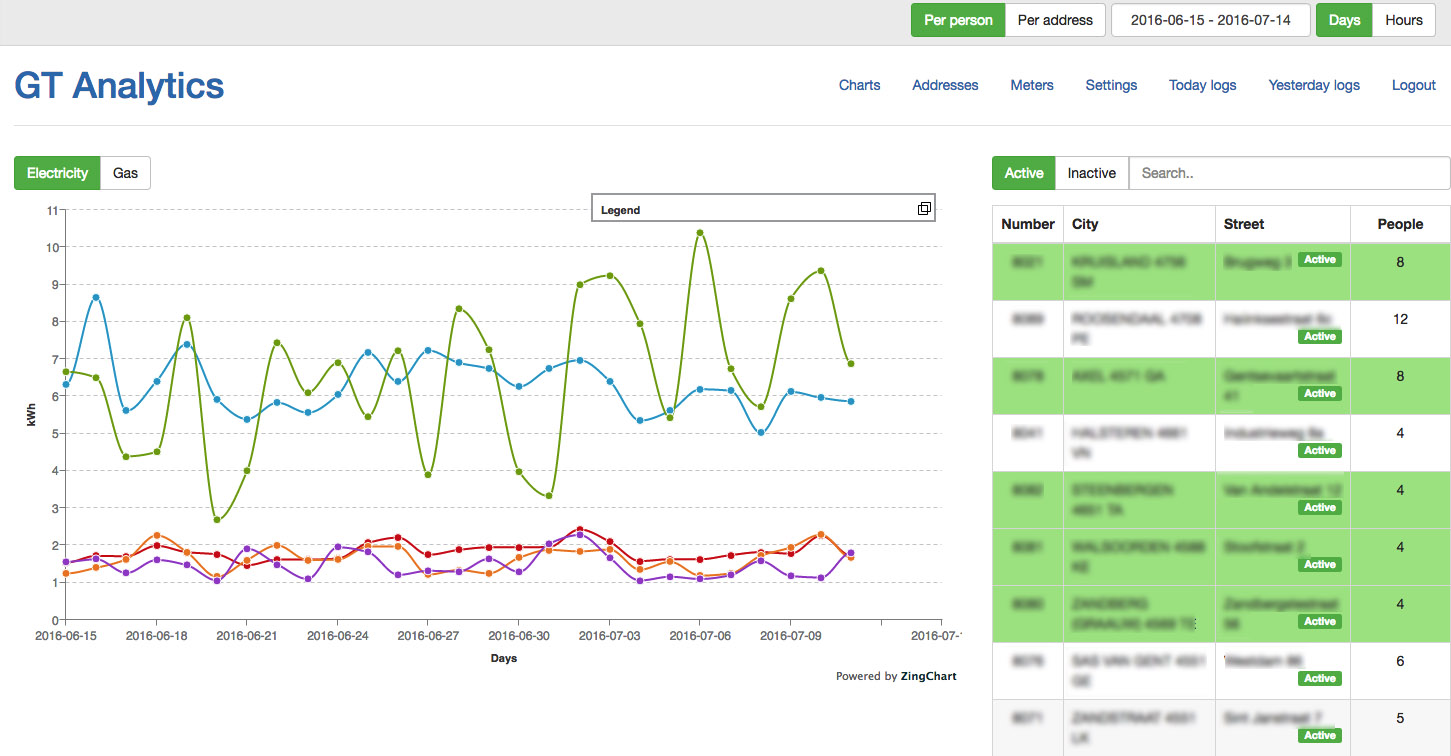
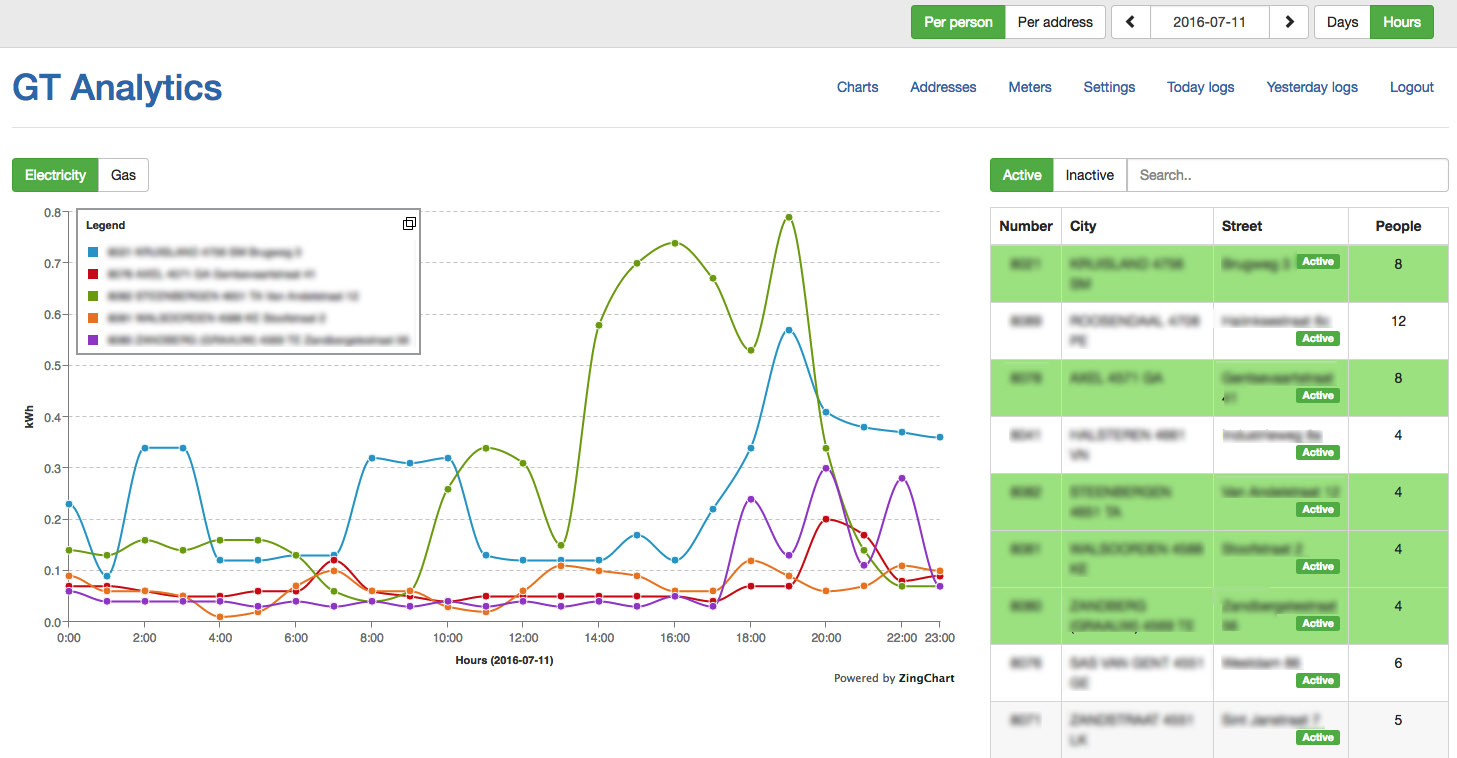
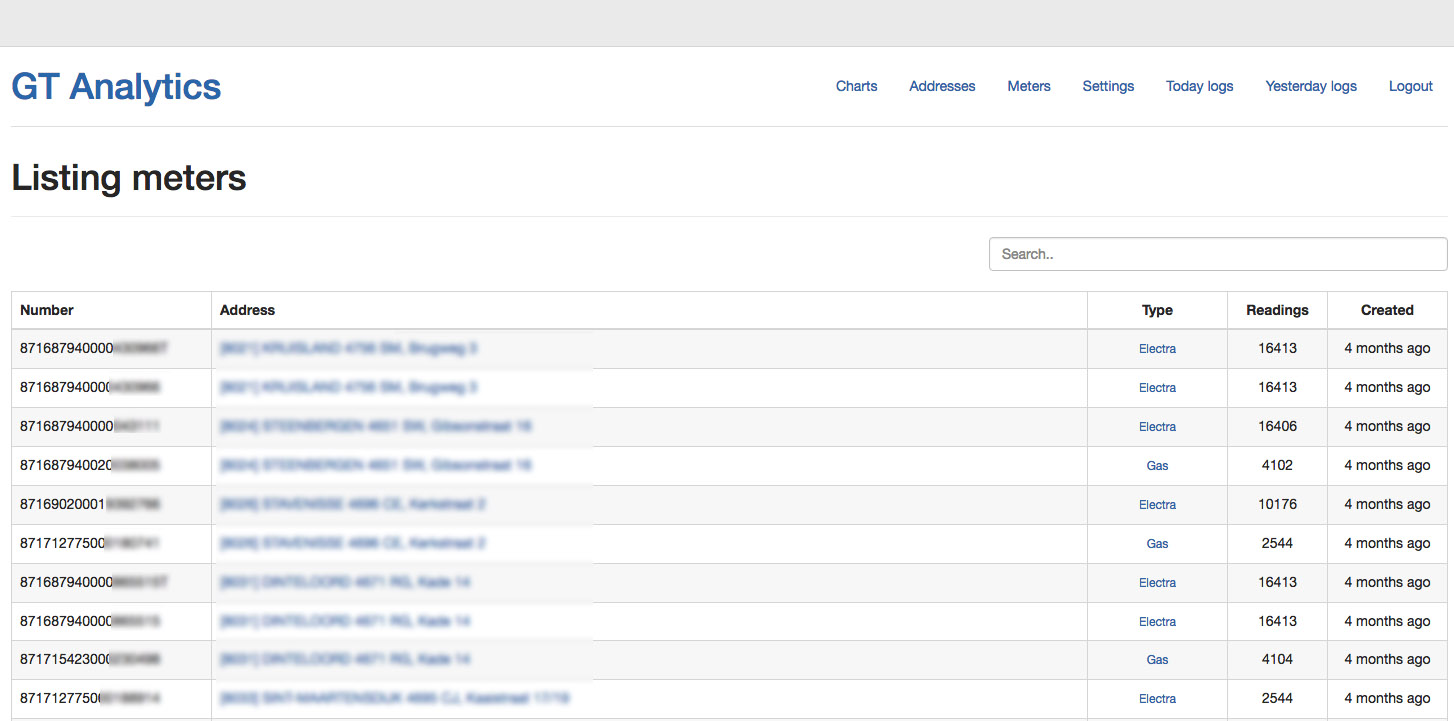
Meters were already installed there (a kind of Smart Meters). They performed readings every few minutes and collected them as files on an FTP server. Viewing and managing these readings was hard, so the client was looking for a solution that would present the data in a friendlier form, like tables and charts. They also wanted to group the data by address, perform comparisons, see daily and hourly usage in selected date ranges and have costs per person calculated automatically.
The solution
A Ruby on Rails web application in three parts:
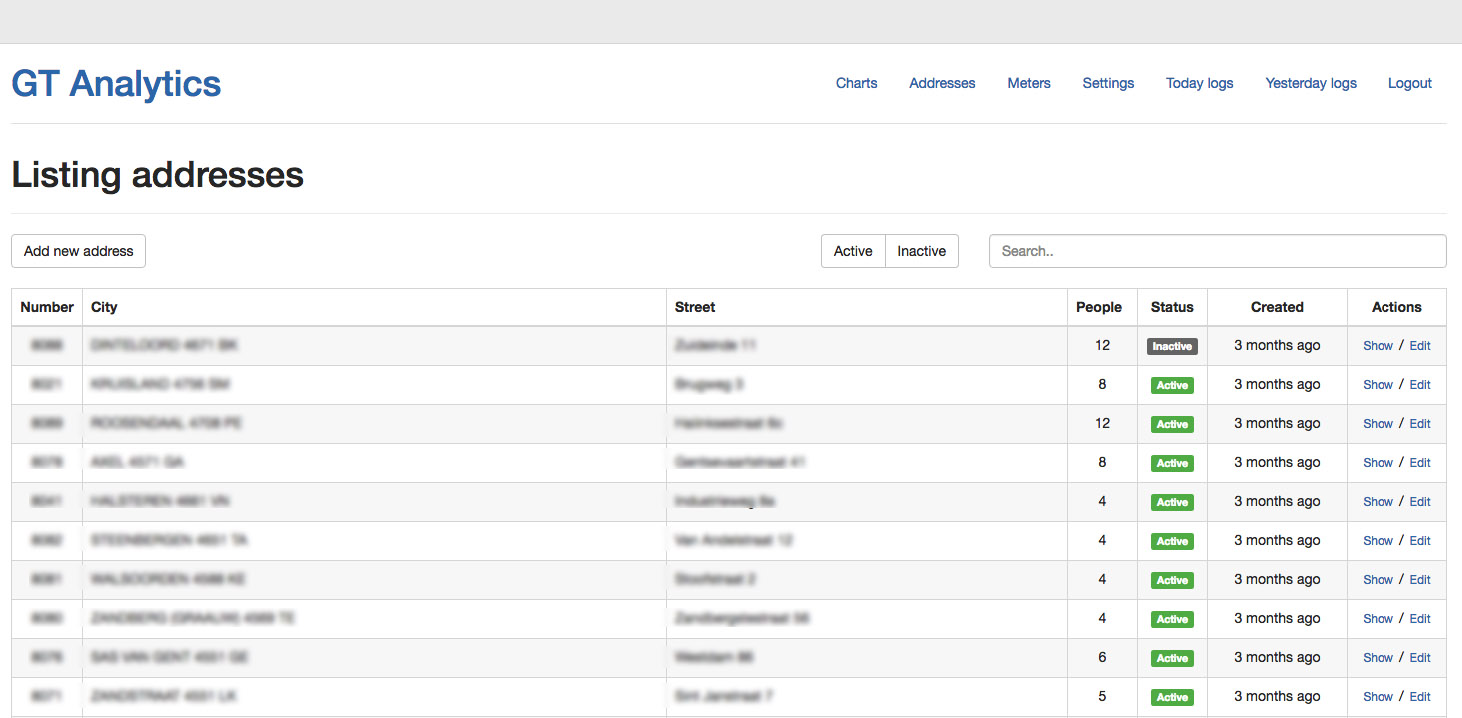
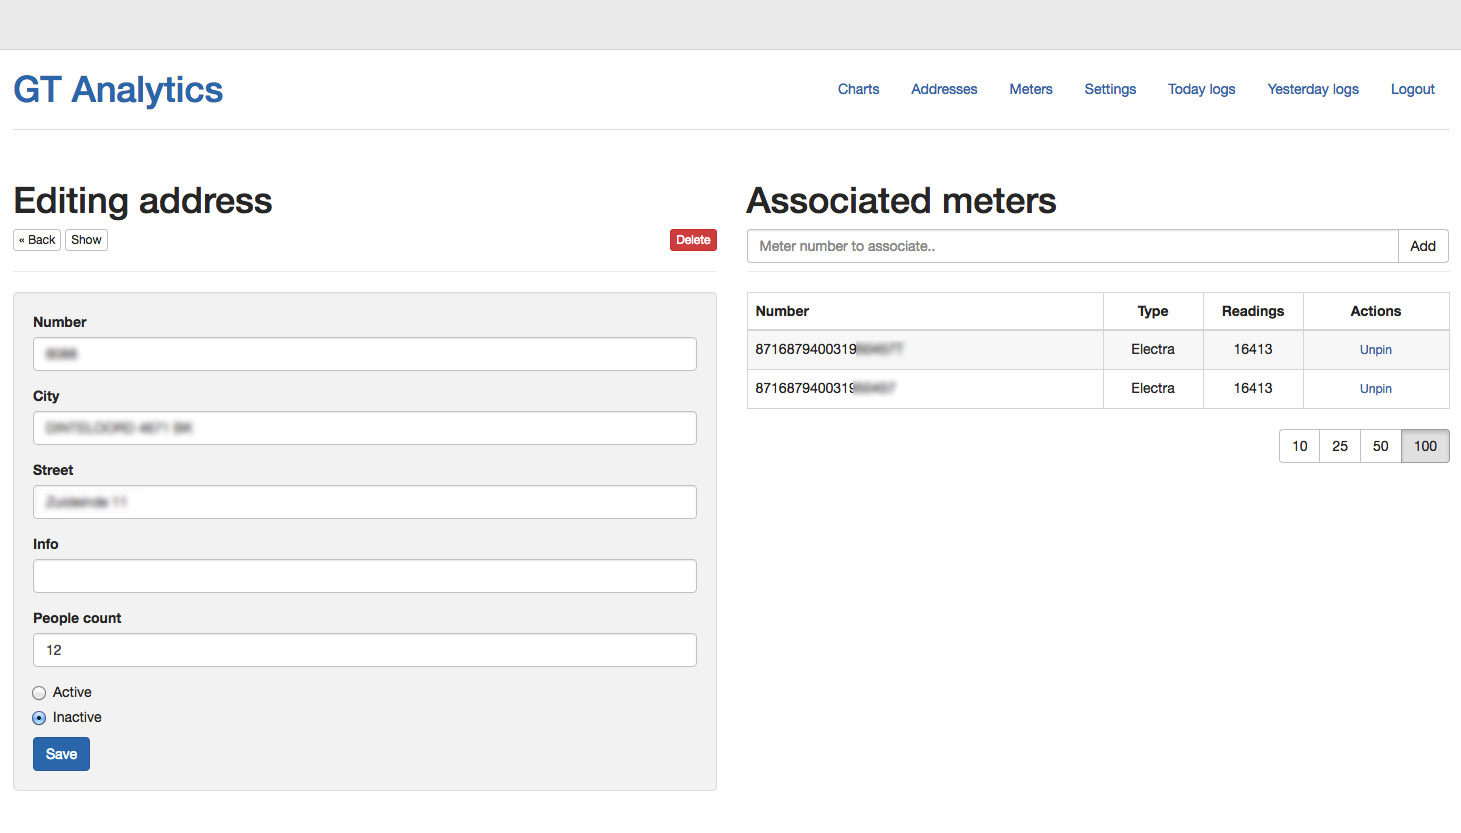
- An admin panel with classic CRUD for managing addresses and settings (Ruby on Rails, PostgreSQL).
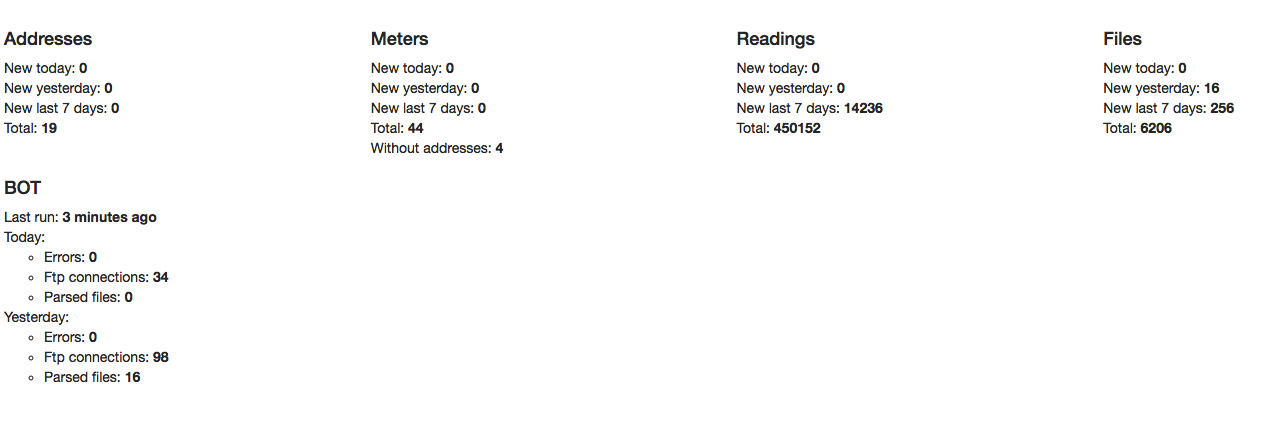
- A script acquiring data from the FTP server (Ruby, CRON).
- A minimalistic frontend with tables and charts (HTML/CSS, Bootstrap 3, JavaScript/CoffeeScript with some AngularJS for better UX).
Before starting, I discussed each part with the client once again, to check that I understood their requirements. We agreed on a time & material payment model, and I presented hourly estimates for each part to give them a sense of the costs. At the end of each part I showed the progress and discussed potential changes or misunderstandings.
Work process
I kept the code quality high: decoupled code, tests, attention to data integrity (validations, foreign keys, unique indexes), handled edge cases, the Ruby style guide checked with Rubocop. Together with a craftsmanship approach, this helped me go through the development process efficiently.
Stack: Ruby 2.2, Rails 4.2, PostgreSQL 9.4, AngularJS 1.4, Bootstrap 3.
The database design behind it is described in the blog post How to design a solid database for Rails application.
Screenshots